Though climate change is pushing our planet to a critical point, nature offers a promising solution. New research shows that natural climate solutions—conserving, restoring & improving stewardship in ecosystems—can drastically reduce carbon emissions in the next decade.
Investing in nature has other co-benefits. It protects biodiversity, enhances social and ecological resilience & reinforces our personal connection to nature.
At Salo we take a holistic approach to ecosystem mapping. We view climate, society & ecology as deeply connected.
So we strive to accelerate the pace and scale of investments in natural climate solutions by using technology to identify conservation opportunities, monitor ecosystem health & predict environmental change.
We use global technologies to co-design local mapping and planning tools, helping governments and landowners understand and manage their environment.
And because mapping is a fundamentally political action, we engage in public outreach and in policy discussions on how to use and regulate technology for environmental management.
What we’re building
A conservation mapping system based on global data
The world’s forests are stressed—by human activity, drought, hot weather, wildfire & pest outbreaks—and these stresses will increase under climate change. There are feedbacks between these processes: droughts increase wildfire severity, and severe wildfires increase emissions and pollute water resources.
With today’s data, we have the opportunity to step back and evaluate the connections between the patterns and drivers of change.

In mapping, we distinguish six themes:
- Ecosystem patterns: the physical state of the forest, like species composition or tree density
- Ecosystem processes: how forests cycle resources, like water, nutrients & carbon
- Ecosystem services: the values provided by forests to people, like regulating water quality and reducing flood risk to downstream cities, providing pollinators to nearby agriculture, and offering recreational opportunities for families
- Patterns of change: including threats to the processes and services provided by forests, like pests or fire suppression
- Drivers of change: the processes that facilitate or perpetuate patterns of change, like climate change or property development
- Management activities: the actions on landscapes that mitigate drivers or problems, like forest thinning or preventative burns
Our monitoring approach is designed to comprehensively map these processes—and we plan to use this technology to help design and implement natural climate solutions.
Technology & science
A deeper understanding of forests with satellites, AI & ecological expertise
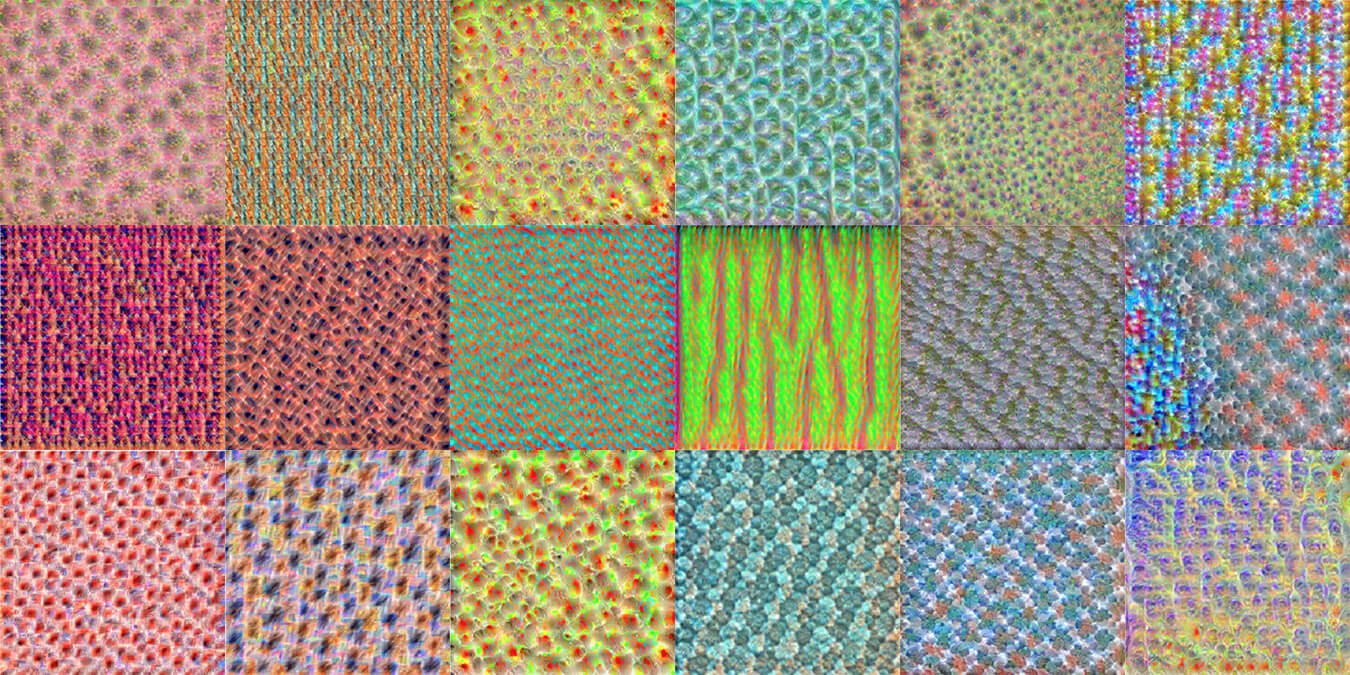
Patterns in satellite images resemble biological cells—like we’re mapping earth with a microscope.
We map forests by applying cutting edge analytics to high resolution satellite data. It takes specific scientific and technical expertise to process and analyze these data. We leverage our unique blend of technical and ecological expertise to transform satellite data into ecological metrics of forest health.
Artificial intelligence is a key tool for our work: it can identify patterns in big, complex datasets. And nature is the epitome of a complex system. We precisely map forests by combining satellite data and AI, revealing new ecological insights at scale. The images above show AI-derived patterns in satellite data, revealing how trees in a forest are distributed like cells in an organism.
Landscape mapping
Making visible the connections between climate, ecology and society
We live in the space age, with unprecedented access to global data and technology. Salo uses these tools to map the impacts of environmental change, including forest growth and death, wildfire risk, timber harvests, carbon storage & shifts in species habitat. Until recently, it was hard to map these patterns at fine scales—the data was too coarse. But thanks to recent innovations we’re no longer limited in this way.
Left: tree height maps from airborne LiDAR, collected in bits and pieces over seven years in the Sierra Nevada. Right: Salo’s AI-derived height maps, covering the full ecoregion, updated every year at pennies on the dollar compared to airborne flights. Drag the slider to compare layers, and zoom in to see the details in each map.