Oct 16, 2019
by Christopher Anderson
Linking ecology and remote sensing is a challenge mostly because the fundamental units of measurement for each field are so different—ecologists measure the distributions, traits & interactions of species, while remote sensing instruments measure the emission, absorption, reflection & interactions of radiation. We typically use information about how vegetation absorbs and reflects light to infer traits like photosynthetic growth rates, phenology & vegetation structure.
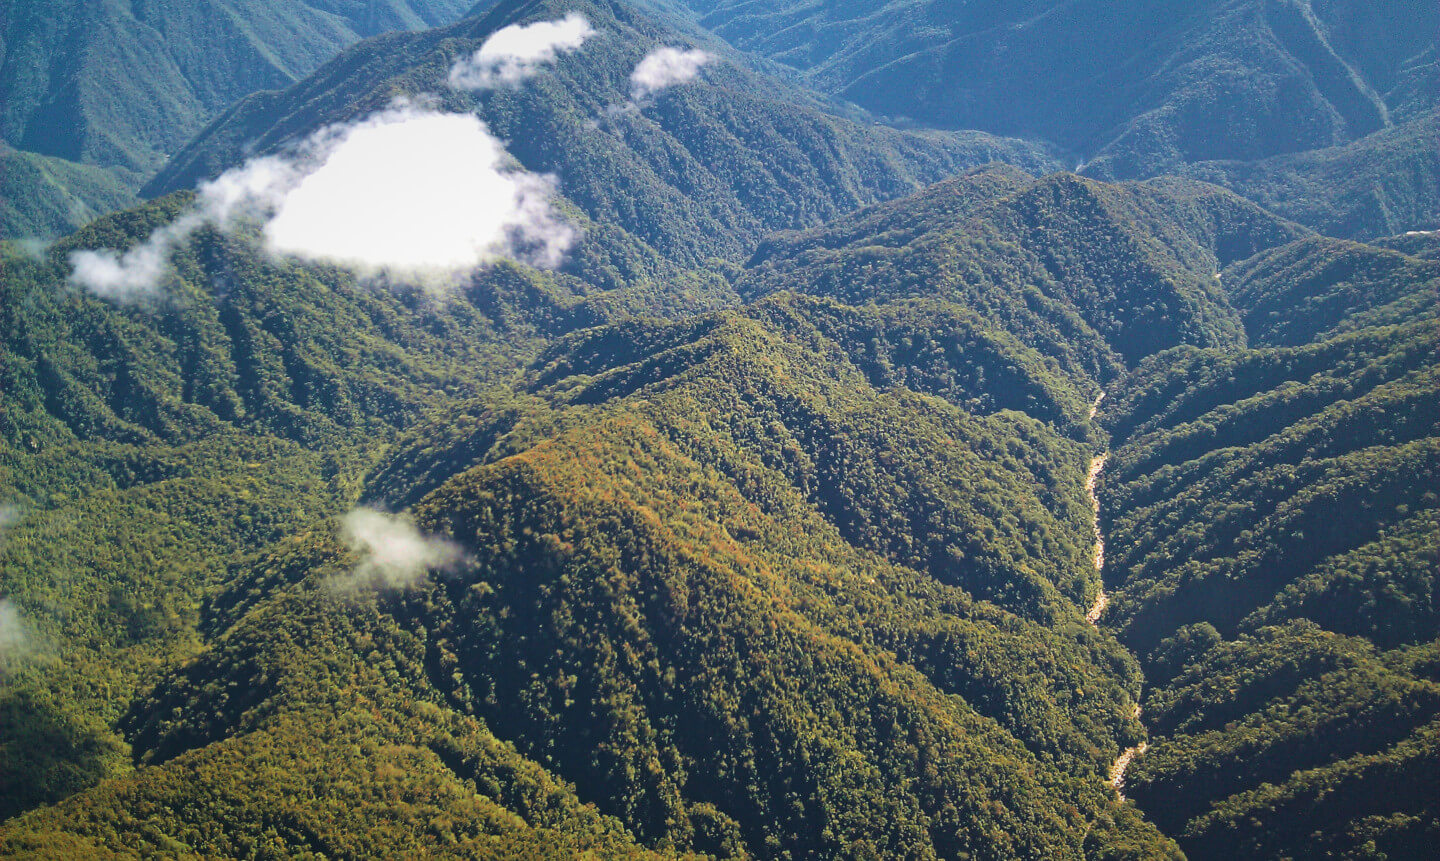
But due to the large pixel size of publicly-accessible satellite imagery—ranging from 10x10 meters to 1km x 1km—it’s hard to resolve individual organisms. Satellites typically measure broader community traits. Being able to resolve and delineate individual trees, as well as identify which species they are, is still a major challenge for remote sensing ecologists.
Developing the technical and conceptual basis for how to map and monitor species over large geographic areas with remote sensing is the focus of my disseration, which I’ve worked on at the Center for Conservation Biology (CCB). This included a review on how concepts of pattern and scale in ecology can be used to analyze and interpret remote sensing information, mostly for vegetation. Essentially, you need sensors that measure at high spatial resolution (to resolve individual organisms), at high spectral fidelity (high signal-to-noise ratio) & high information content (measuring patterns that captures differences between species). Unfortunately you can’t get all three from satellites.
But you can from airplanes. Airborne imaging spectrometers, operated by NEON and the GAO (formerly CAO), collect high resolution, high fidelity data measuring 400+ bands of radiation from the visibile to the shortwave infrared spectrum—hrough a hole cut in the bottom of a plane. But these data are tricky to work with for most ecologists. Not everyone has spent years mapping forests from airplanes with fancy cameras strapped to them. So, to reduce this one technical hurdle to developing species mapping systems, I published an open-source tree species detection algorithm using NEON data, CCB-ID as part of a data science competition.
Airplanes can only take you so far, though. They don’t have the same synoptic, global perspectives as satellites. Can we merge these two data sources—from airborne and satellite sensors—to map species at the scale of individual trees across large landscapes?
We attempted to do so during this week’s Planet Hack event, hosted by Planet Labs, one of Salo’s key partners.
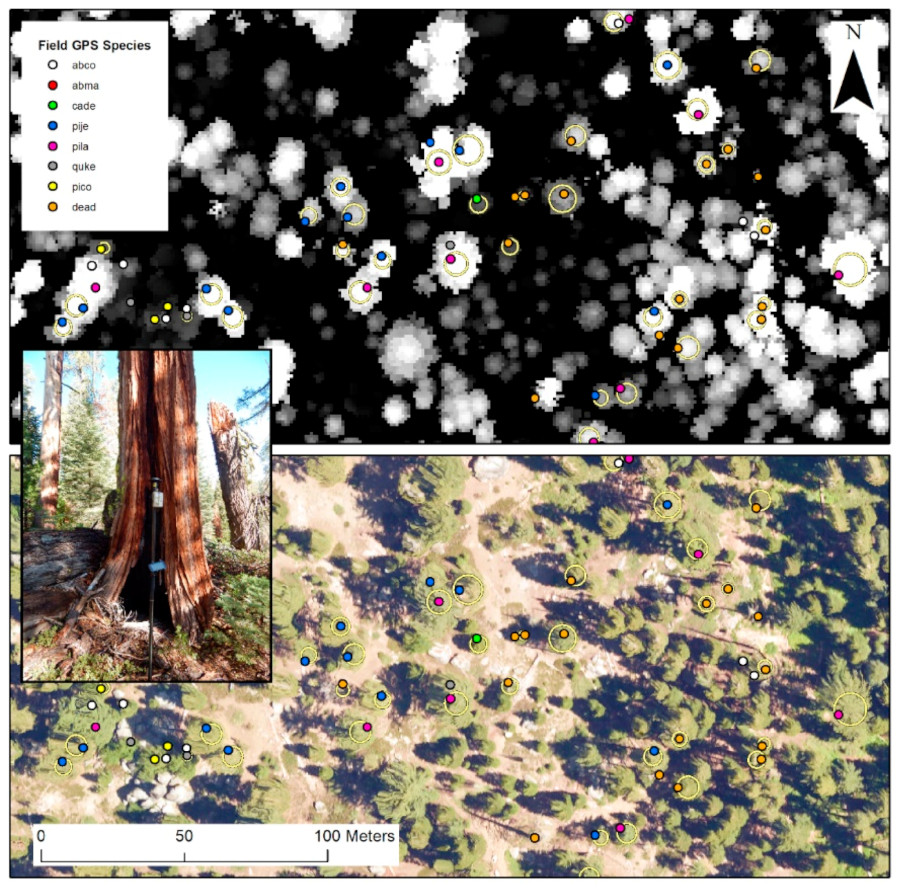
For our airborne species maps, we leaned heavily on this excellent work by Geoff Fricker et al. This team developed a NEON-based species mapping algorithm, similar to CCB-ID, and applied it to airborne imagery from the Southern Sierra Nevada. In their work, they mapped 9 classes: bare ground, 7 tree species & 1 class of dead trees. They published both the data they used as well as the software they used, which were easy to read, run & reproduce. Their work is an example of excellent open science. Their tree species classification map was our response data.
For our high resolution satellite data, our feature data, we used 3 meter resolution PlanetScope imagery provided for the event. This seemed risky: PlanetScope data have just 4 bands. It seemed unlikely that these data would have the right information content to be able to discriminate tree species when compared to the 400+ spectral bands of NEON. We did two things to try and mitigate this risk.
First, we used two time steps of imagery: one from spring, one from fall. Because trees typically maintain species-specific phenological cycles that are mostly consistent within a species, we anticipated that more time steps would provide more information to distinguish between species.
Second, we used a U-net algorithm for our classification. U-net refers to a 2D convolutional neural network architecture commonly used to classify image pixels. One key feature of U-nets, and of 2D CNNs generally, is that they use contextual information—like the patterns of nearby pixels—to classify each individual pixel. They’re great for classifying data that’s highly spatially structured, even if you don’t have high spectral fidelity.
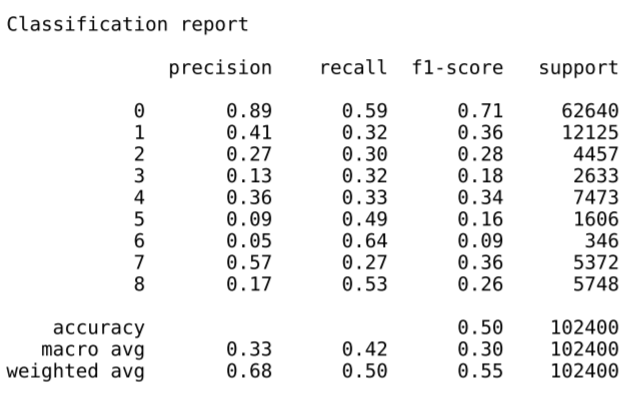
We had little time to evaluate different model types or architectures, as this was the product of a single day’s work, including data gathering, data processing & model training. However, we were heartened to see reasonable model performance after our first training effort. For a 9-class prediction, scores higher than 11% are the benchmark for better than random, and our weighted average scores beat that mark by a wide margin. But they leave plenty of room for improvement.
The problem with this kind of work, however, is that it’s easy to be over-confident when the results look so much better than the statistics would suggest.
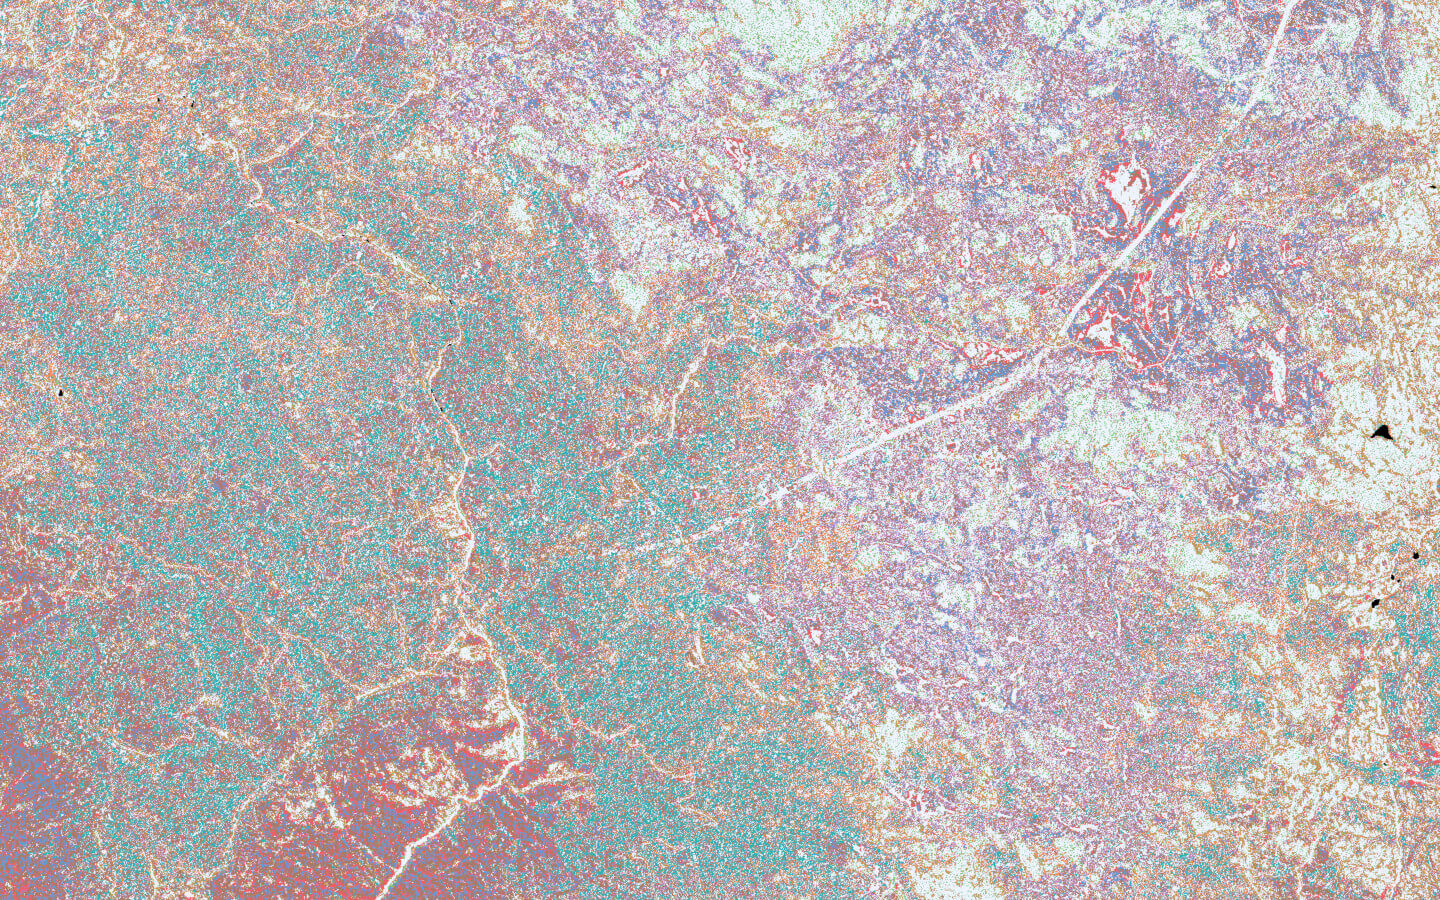
The model identified strong spatial structure in the input data. The predictions expressed a lot of traditional ecological patterns—preferences for ridges and valleys, turnover along elevation gradients, clumping of individuals from similar species, co-occurrence and exclusion dynamics—without their explicit inclusion as input data.
Because spatially-dependent patterns are so common in ecology—dispersal, competition, resource availability—we see algorithms that leverage spatial context, like 2D convolutional neural networks, as an indispensable tool for mapping these patterns in high resolution imagery. Spatial patterns themselves are likely not enough to build an operational species mapping system, but these preliminary results suggest that with more data and more modeling effort we should be able to significantly improve species predictions.
This kind of landscape-wide, tree-scale species mapping is both rare and beautiful. We see at tremendous opportunity to use and share these data to better understand macroecology and biogeography in ways we hadn’t been able to before, simply because it was too hard to map out every dang species over such large areas. And we’re inspried by the opportunity to advance the use of new technologies and data for scientific understanding and conservation. Get in touch if you’re interested in collaborating on future species mapping efforts.